Results
Updated Jul 11, 2026
Every backtest comes with multiple charts, extensive stats, and detailed trade logs.
Charts
You get multiple charts with each backtest:
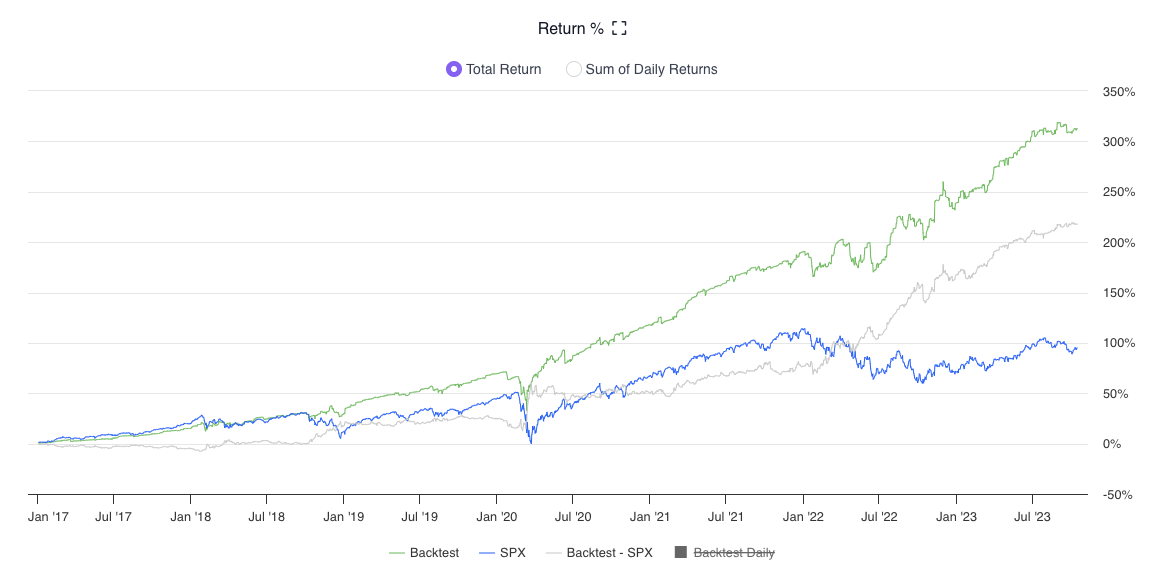
Total Return
This chart shows total return, which is (Ending Balance - Starting Balance) / Starting BalanceThis includes compounding and is representative of actual portfolio growth over time.
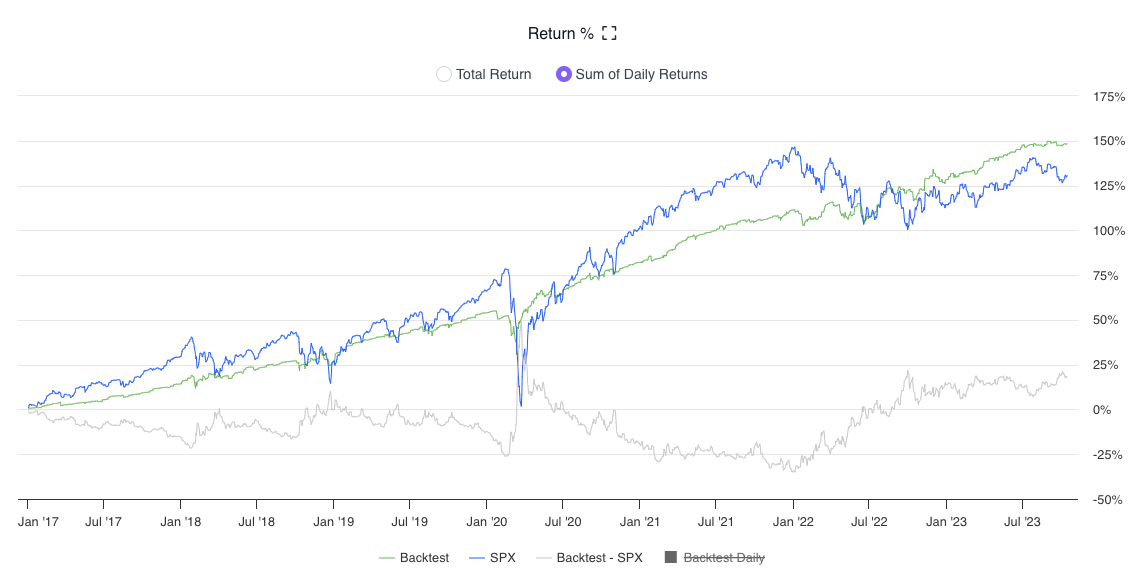
Sum of Daily Returns
This shows a running sum of daily return percents as compared to the underlying symbol. Return % is calculated using daily profit/loss as a percentage of the portfolio's balance. These daily percentage returns are added up every day to draw the chart lines. Therefore, this chart does not include compounding. It is simply the sum of daily returns. This is good for a visual representation of performance over time without the impact of compounding or sequence of returns.
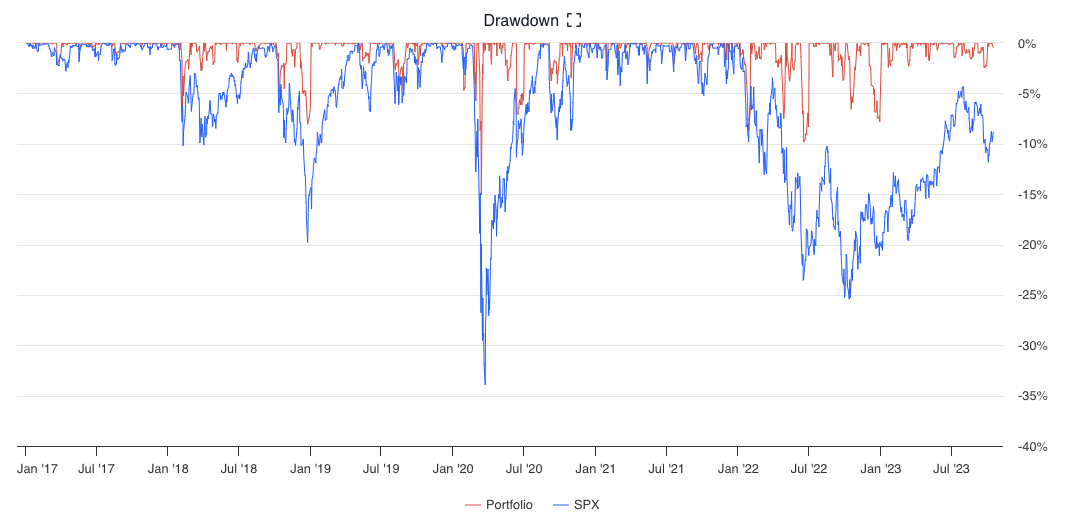
Drawdown
This plots the current drawdown percent for the backtest against the underlying.
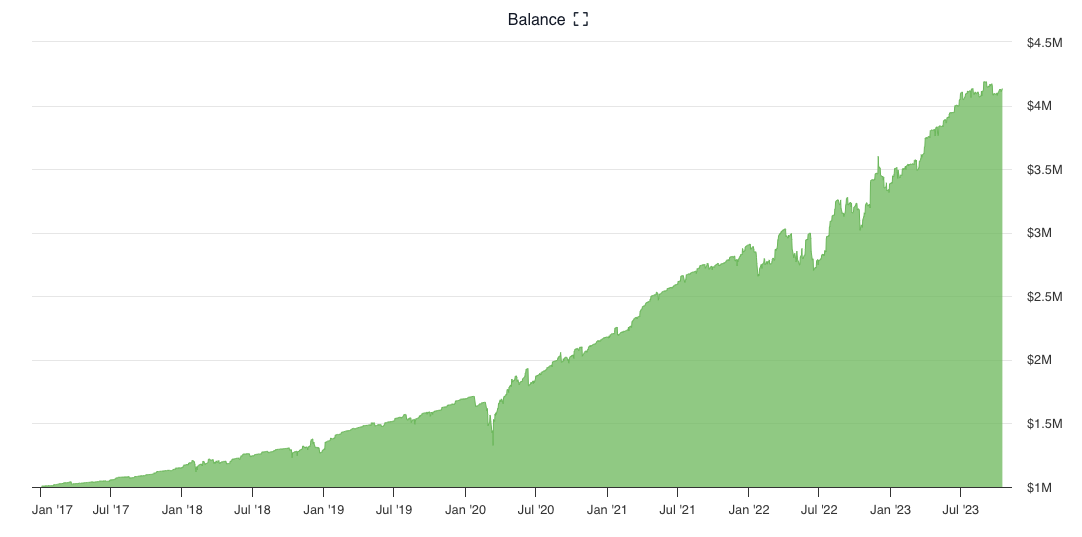
Balance
This is the running portfolio balance over time
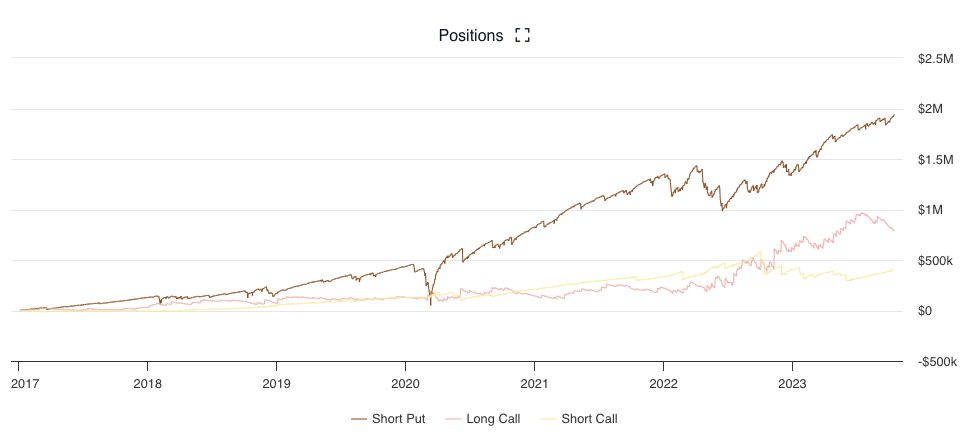
Positions
This shows the total return for each position on the backtest. This is how much each position contributes to your P/L. The position's are named and color-coded based on their backtest settings.
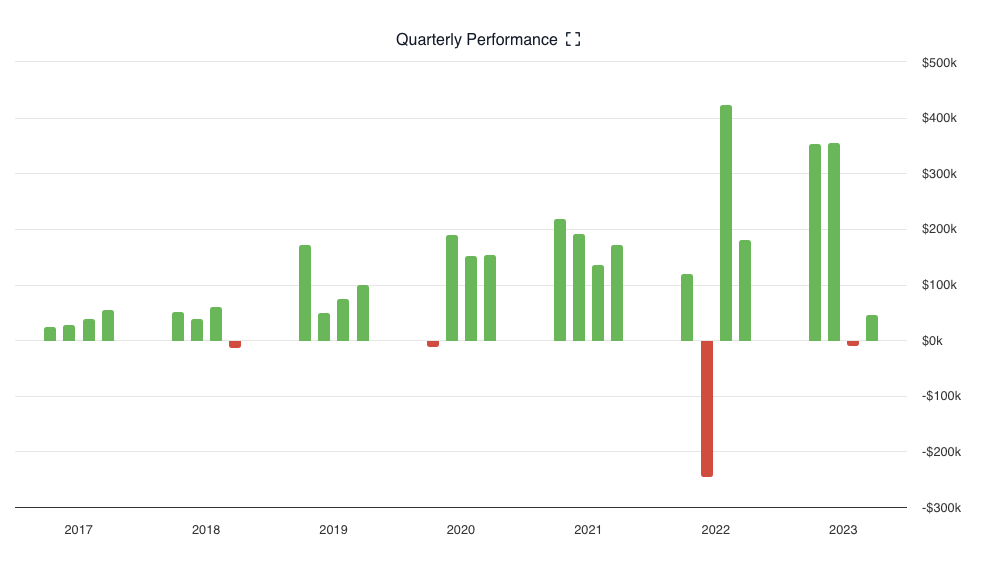
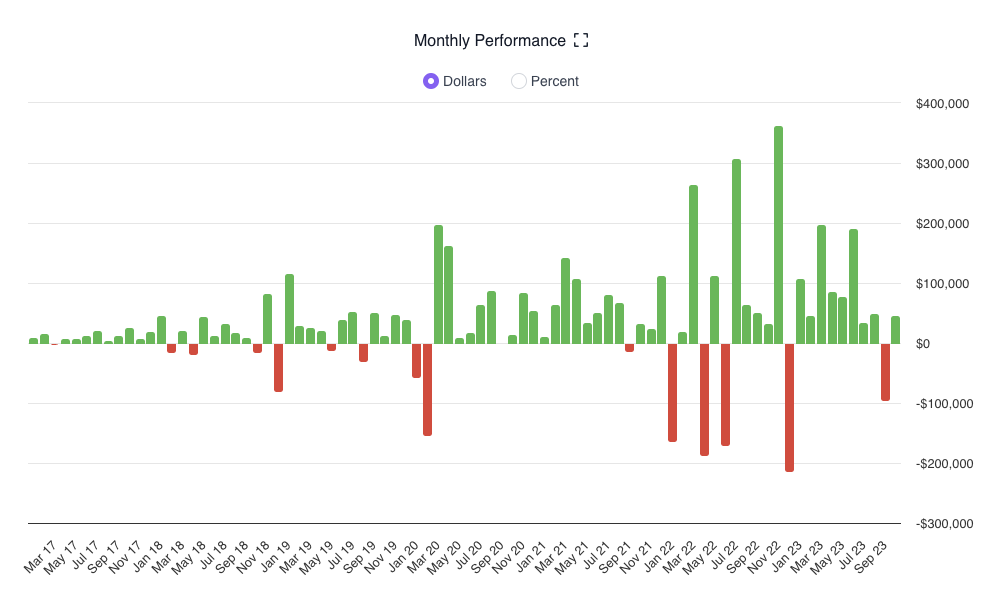
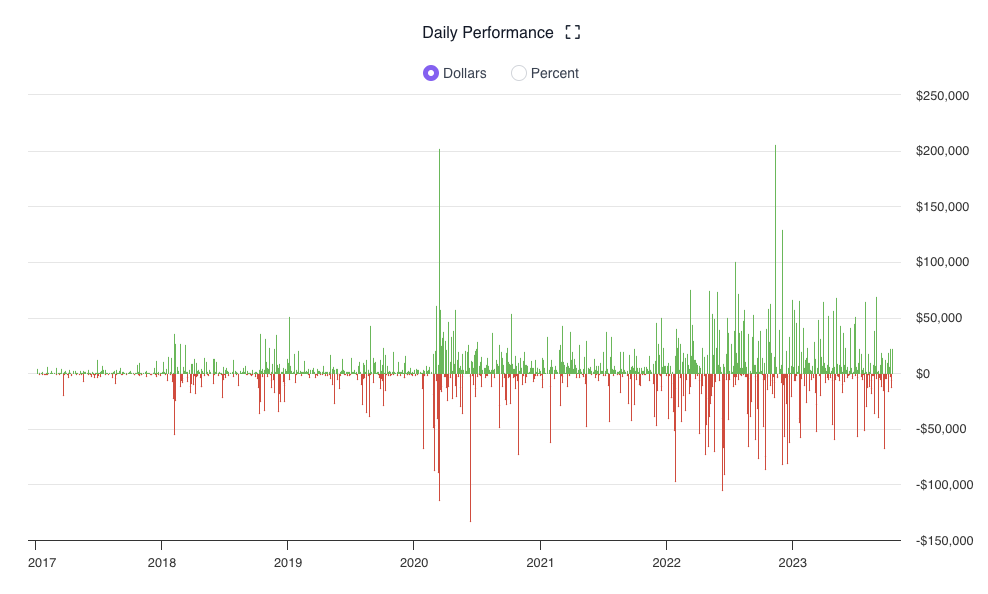
Quarterly / Monthly / Daily Performance
These show the returns within their respective periods. Monthly and Daily charts come in both Dollar and Percent format.
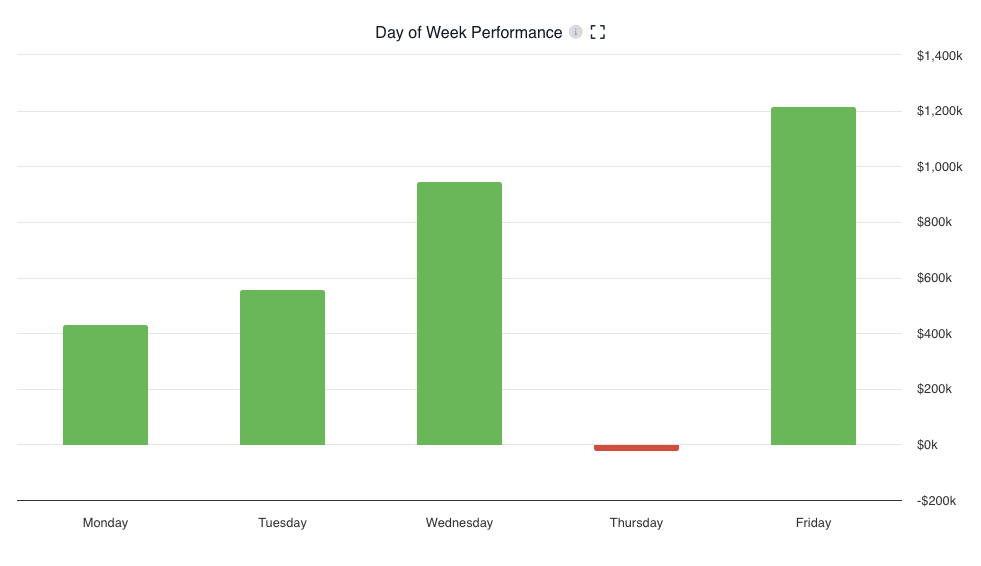
Day of Week Performance
This shows total profit (realized and unrealized) for each day of the week during the backtest duration.
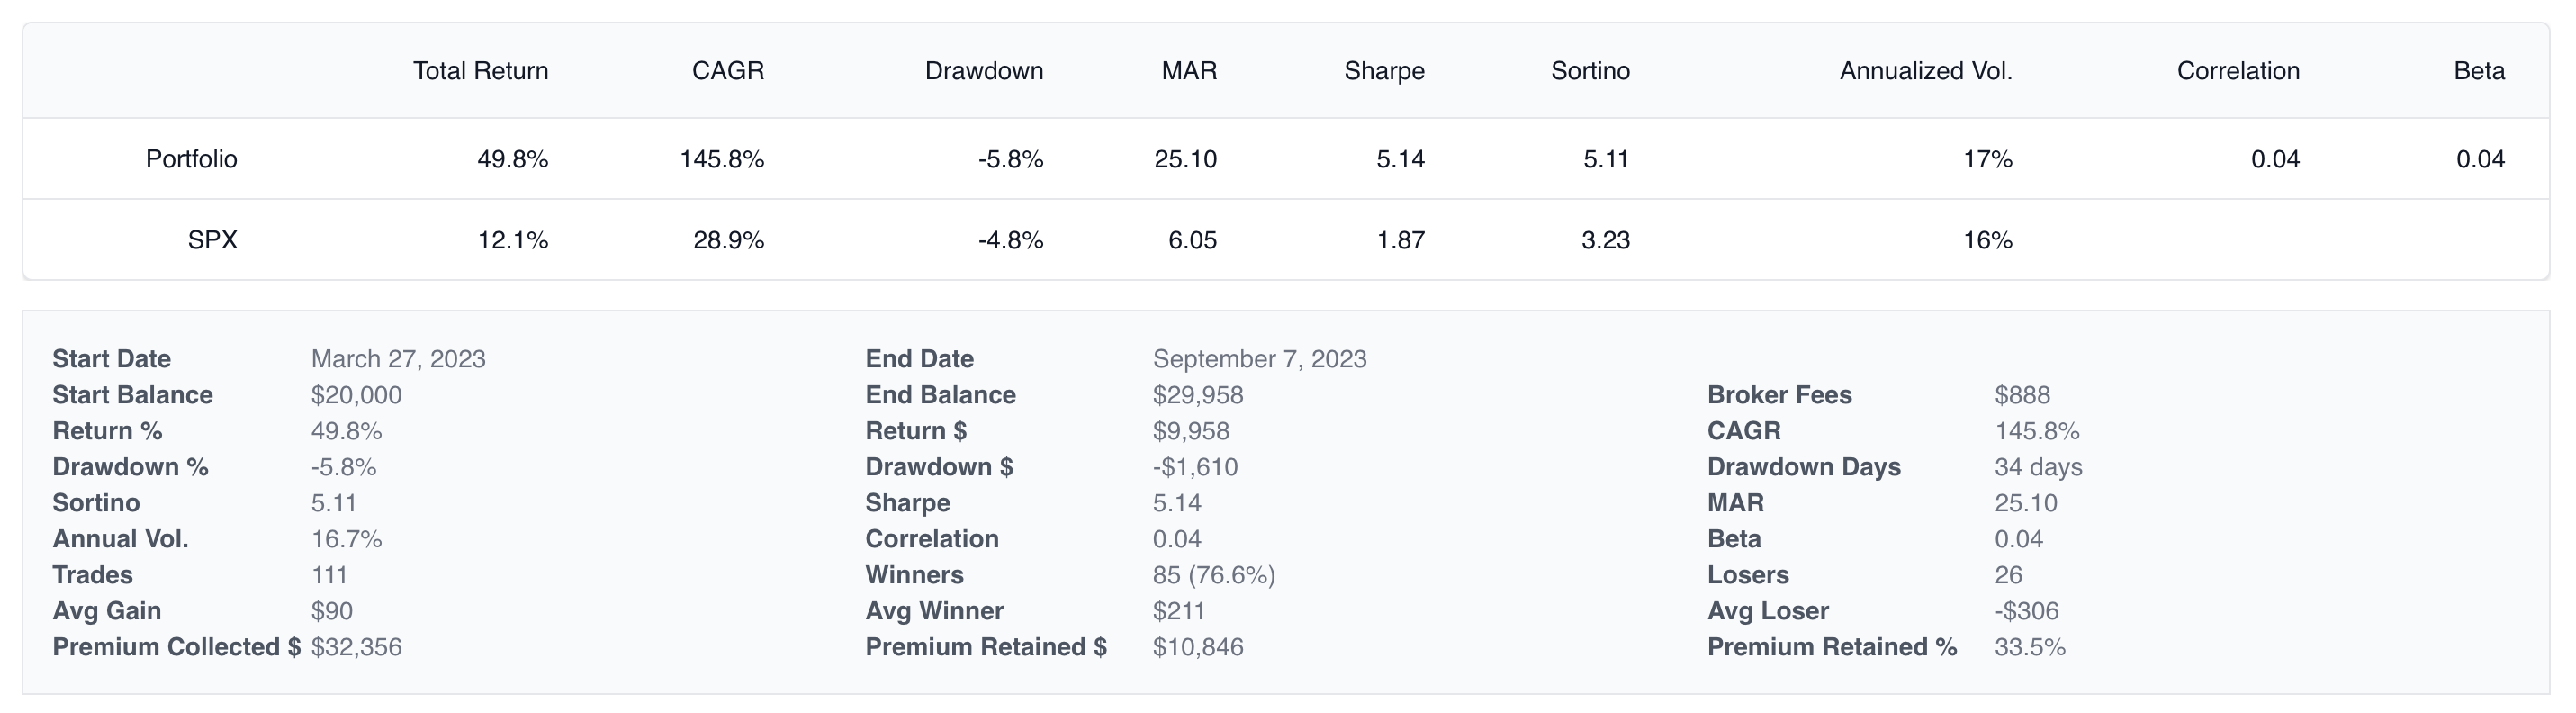
Stats
Below each backtest, you'll get a generous list of statistics and risk-adjusted metrics along with a year and month breakdown for return.
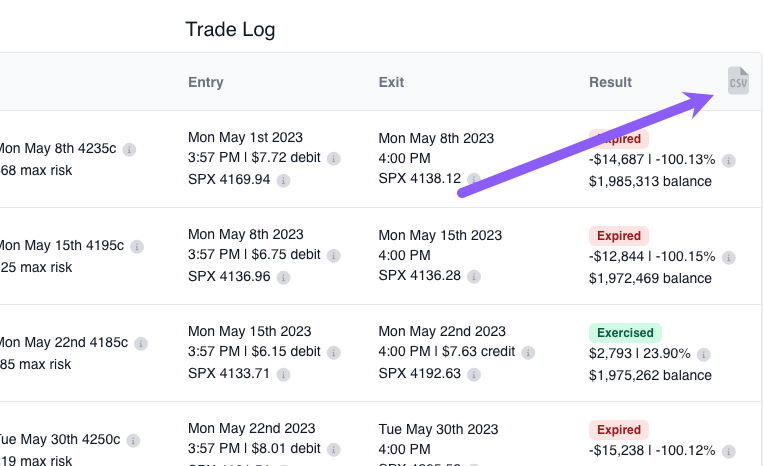
Trade Logs
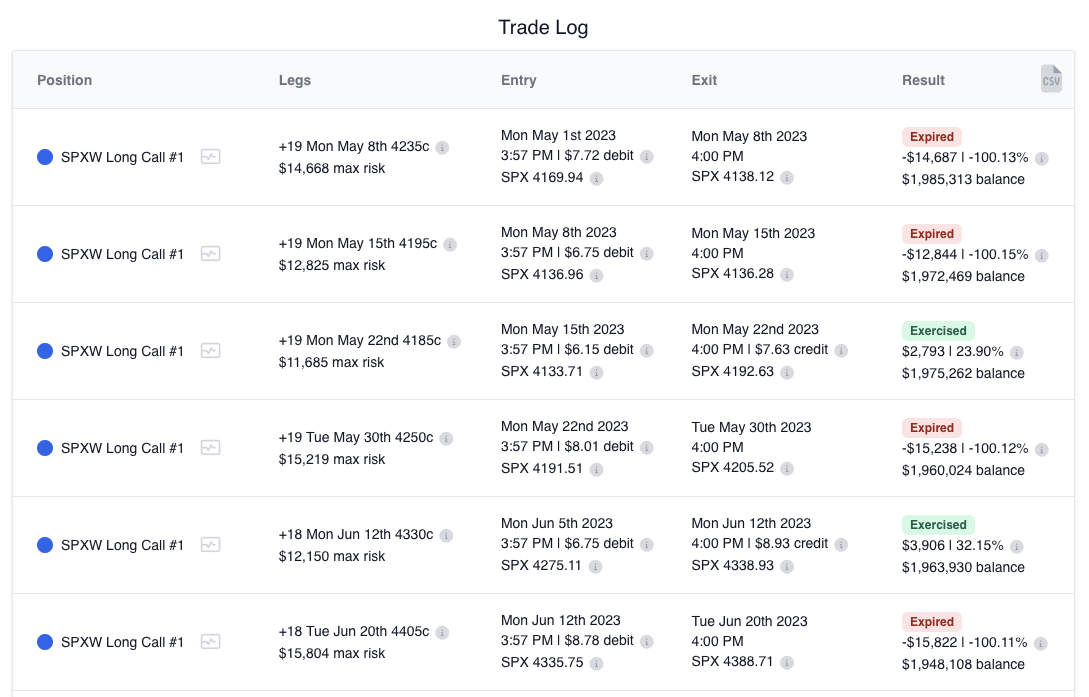
Export to CSV
Click the CSV button at the top of the trade log to export all of the backtest's trades to CSV to group and churn as you please.
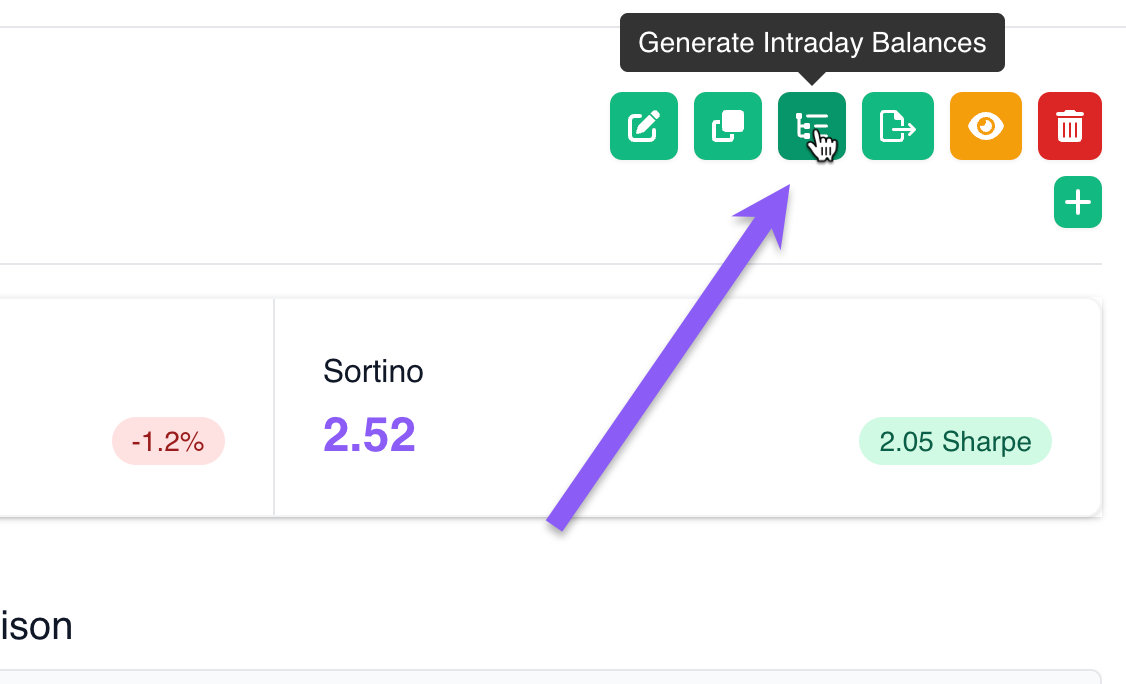
Intraday Balances
Our backtester has the ability to track the running balance every minute of the day over the entire backtest period so that you can see how the portfolio would move throughout the day with all open positions. This recording process is data-intensive, so we don't automatically perform it every time a backtest runs. If you'd like to see these intraday balances, view one of your complete backtests and click the "Generate Intraday Balances" button near the top:
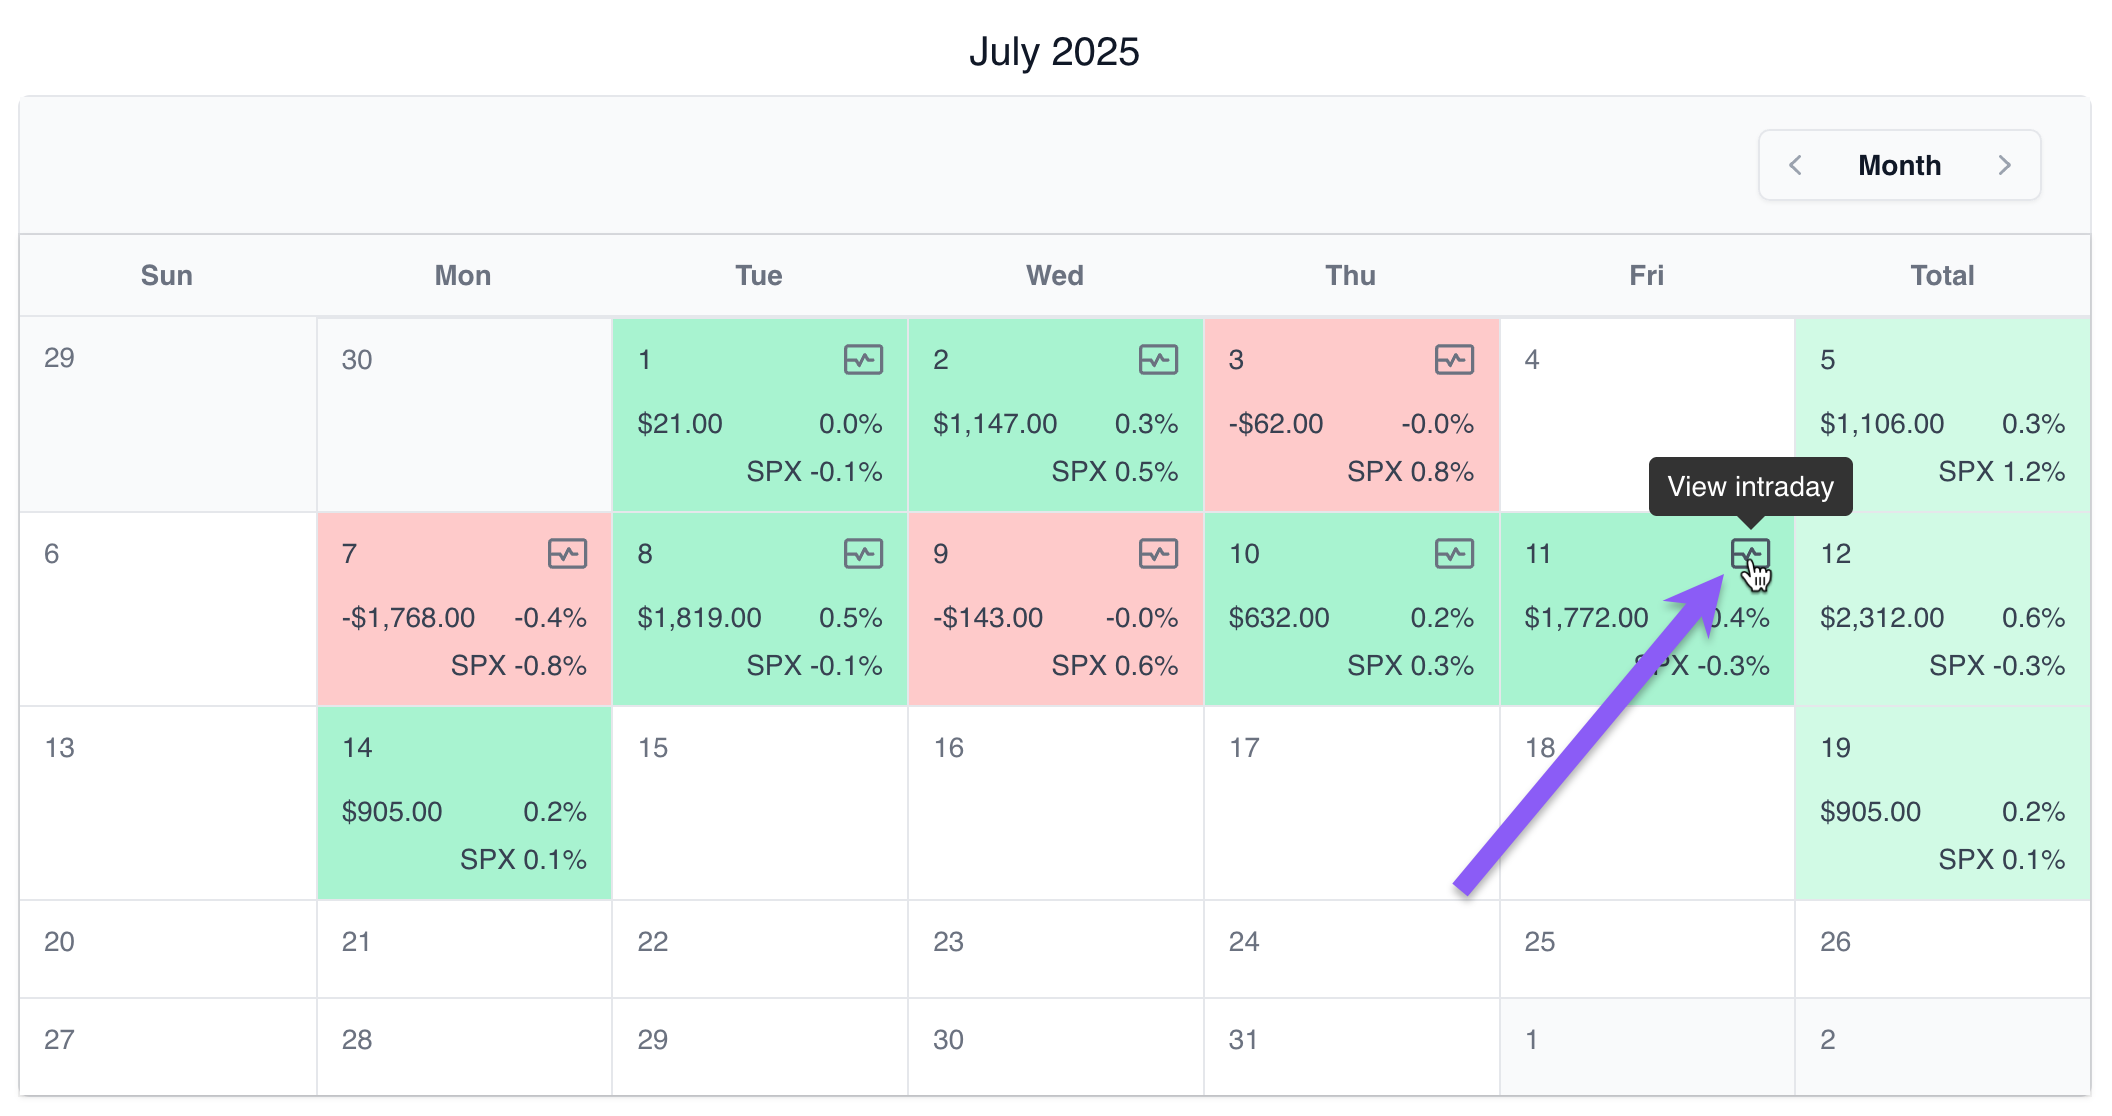
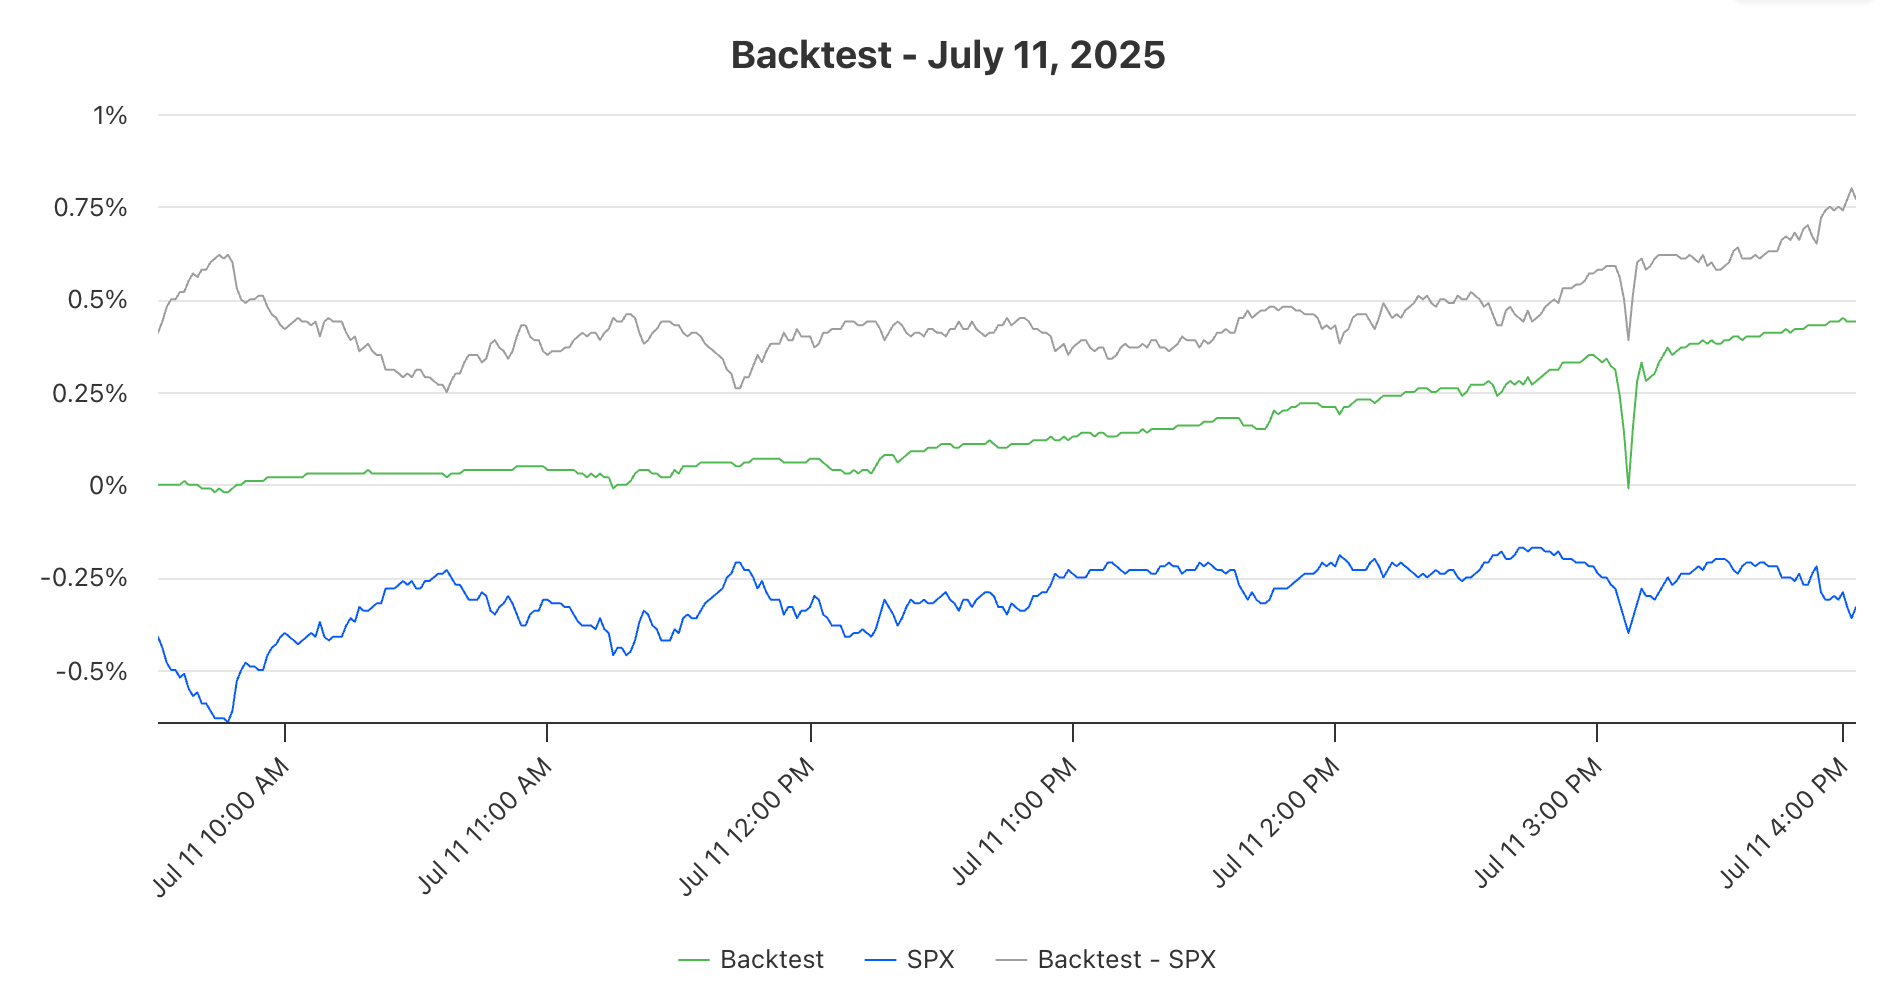
Once you click the button to generate intraday balances, this process will start behind the scenes. It may take a while depending on how large your backtest is. As it progresses, you'll see buttons show up in the calendar view. You can click one of these buttons to see an intraday chart that compares the backtest return against the underlying.
Intraday drawdown and rally statistics will also be included in the backtest days export if you'd like to report on that as well. That is from the "Export Days" button at the top of the backtest.
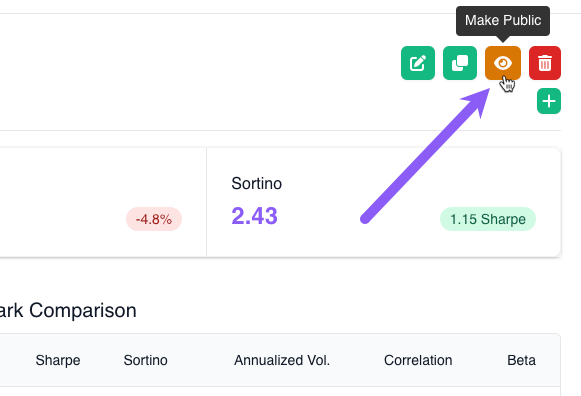
Sharing Results
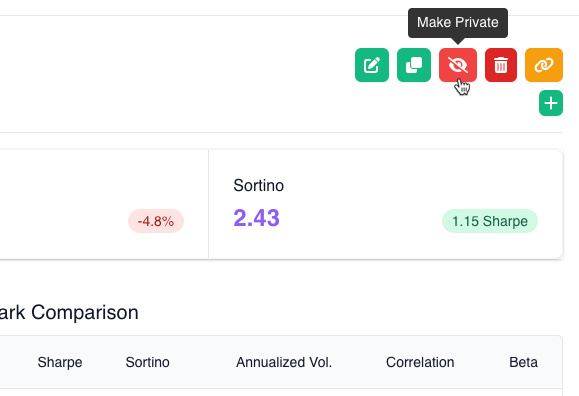
By default, any new backtest is private and only visible to you. If you'd like to share your backtest results with others, click on the orange eye towards the top of the backtest.
After clicking this, you can now share the URL with anybody to view. If you change your mind and want to make the backtest private again, click the new red eye icon: