Dashboard
Updated Jul 11, 2026
Dashboard Statistics
Your Whispertrades Dashboard includes configurable account and bot statistics at the top of the page. Some of these numbers come directly from your brokerage account, some come from Whispertrades bots, and some combine data from both. This page will explain what is behind each of the numbers.
Net Liquidation Value
This is the total value of your brokerage account. If you have more than one brokerage account connected to Whispertrades, this will show the total of all connected accounts.
Option Buying Power
This represents available option buying power in your brokerage account. If you have more than one brokerage account connected to Whispertrades, this will show the total available option buying power for all connected accounts.
Additionally, there is a percentage at the bottom right of this metric which represents the percentage of your available option buying power compared to your total account value (net liquidation value). This percentage is your option buying power available, not percentage utilized.
Notional Held
This is your total notional value held by Whispertrades bots only. It does not include notional held by other positions in your account that were created outside of Whispertrades.
The Notional Held number will offset short puts and calls for each symbol in your account. If you have bots that hold both short puts and short calls for the same symbol, the Notional Held figure will take the largest notional value of the two sides (puts and calls) and use that amount for this figure.
At the bottom right of the Notional Held box, you will see a number multiplier. This indicates the amount of leverage held by your bots when compared to your total account value (Net Liquidation Value). Again, this leverage factor only includes leverage used by Whispertrades bots and not from other positions in your account outside of Whispertrades.
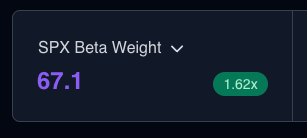
SPX Beta Weight
This will look at all current open bot positions and calculate their beta weight against SPX. The large number represents how much your total NLV will change with each 1 point move in SPX. If your beta weight is 50, then your NLV will increase $50 for every 1 point move up in SPX. Your beta weight can also be negative. If your beta weight is -100, then you will lose $100 with every 1 point move up in SPX, but you'll gain $100 with every 1 point move down in SPX. This beta weight is dynamic and will change as your portfolio and SPX move.
There is also a multiplier value in smaller text and to the right of your SPX Beta Weight. You may see something like "1.3x". This means that your NLV will move 1.3x more than SPX. As SPX goes up 1%, your NLV will increase 1.3%. This, too, can be negative, if your bot positions are currently net short against SPX.
In the example below, the portfolio will move up $67.10 for every 1 point move in SPX. This is 1.62x faster than SPX. A 1% move in SPX will result in a 1.62% move in the portfolio. But understand that these numbers are dynamic, and as SPX moves up and down, these values will change as well.
Beta weighting will analyze all open bot positions in your portfolio and compare the underlying stock's volatility (beta) to SPX. It doesn't matter which symbols you are trading, whether SPX itself or QQQ or TSLA. Your dashboard will analyze all of your holdings and compare them to SPX as a standard benchmark.
To calculate each underlying's beta value (ie: TSLA's volatility relative to SPX), Whispertrades uses weekly returns for the previous 2 years.
Short Premium Open
This represents the total of all premium that you currently have open from credit positions (ie: Short Call, Put Credit Spread, Iron Condor), This is the net premium from these positions, meaning it is the total credit received from the short legs minus the debit paid for the long legs (if any).
To the bottom right of the dollar value is a percentage which is the dollar amount as a percentage of your Net Liquidation Value.
Long Premium Open
This represents the total of all premium that you currently have open from debit positions (ie: Long Call, Put Debit Spread, Long Straddle), This is the net premium from these positions, meaning it is the total debit paid from the long legs minus the credit received from the short legs (if any).
To the bottom right of the dollar value is a percentage which is the dollar amount as a percentage of your Net Liquidation Value.
Profit Open
This displays unrealized profit for all positions currently open by Whispertrades bots.
To the bottom right of the dollar amount is a percentage. This percentage is divided against your Net Liquidation Value, not the bot's max risk.
Profit Today
This displays realized and unrealized profit since market open for all positions currently open by Whispertrades bots.
To the bottom right of the dollar amount is a percentage. This percentage is divided against your Net Liquidation Value, not the bot's max risk.
Profit Year/Month/Week to Date
This displays realized and unrealized profit for all Whispertrades bot positions over the specified timeframe. The percent return calculates total return for bots in your portfolio, while ignoring the impact of any external transfers or other investments.
Dashboard Charts
The dashboard features two charts: the default chart showing your bot balance history over time, and the second showing return percentage from all bots against an underlying of your choosing.
Balance Chart
This chart is simply the sum of all profit that your bots have generated since your Whispertrades activity started. This includes both realized and unrealized profit.
Return % Chart
This chart displays total bot return for your connected brokerage account(s). This represents the percentage return your bots are generating for your brokerage account(s) and properly accounts for the impact of any external transfers or other investments.